ImplementedInternship Project / Data Dashboard / Low-Code Workflow
Maintenance Reporting Workflow & Dashboard
A digital maintenance reporting workflow and dashboard system developed during my internship at PT Saprotan Utama Nusantara. The system replaced scattered manual reporting with structured form input, standardized equipment mapping, and Looker Studio dashboards for operational monitoring.
ReportingDashboardLow-CodeOperationsInternship
Project Preview
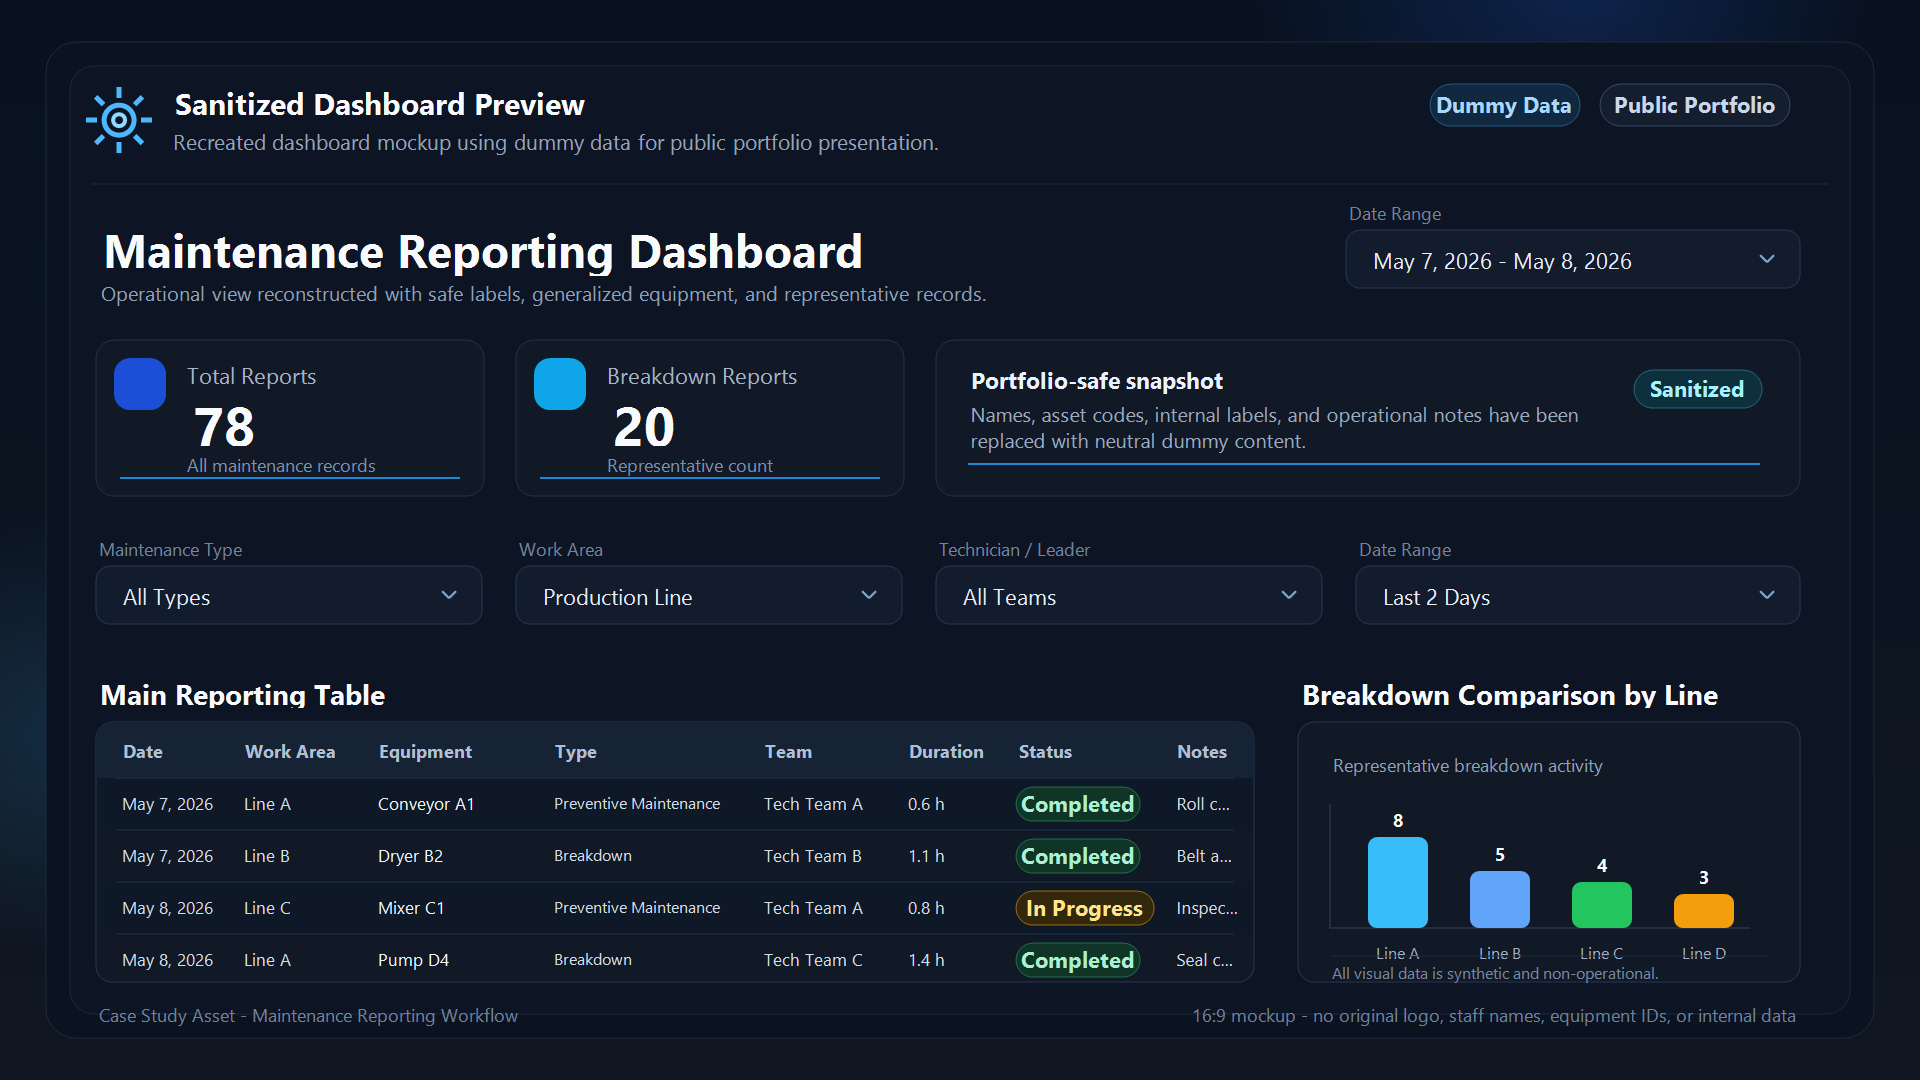
Sanitized Dashboard Preview
Problem
Manual and scattered maintenance reporting made it difficult to monitor equipment issues, technician activities, and recurring problems consistently.
Goal
Create a clearer maintenance reporting flow so technician activities, equipment issues, breakdowns, and downtime could be monitored from structured data instead of scattered manual notes.
My Role
Designed and implemented the reporting workflow, form logic, data mapping, and dashboard structure.
Tools / Tech Stack
Tally.soGoogle SheetsLooker StudioAppSheetExcel
Key Features
Structured maintenance report form
Conditional area-section-equipment logic
Equipment code auto-lookup
Google Sheets data layer
Looker Studio dashboard
Breakdown and downtime analysis
Filters by area, equipment, and technician
Screenshots
Sanitized Looker Studio dashboard preview for operational monitoring.
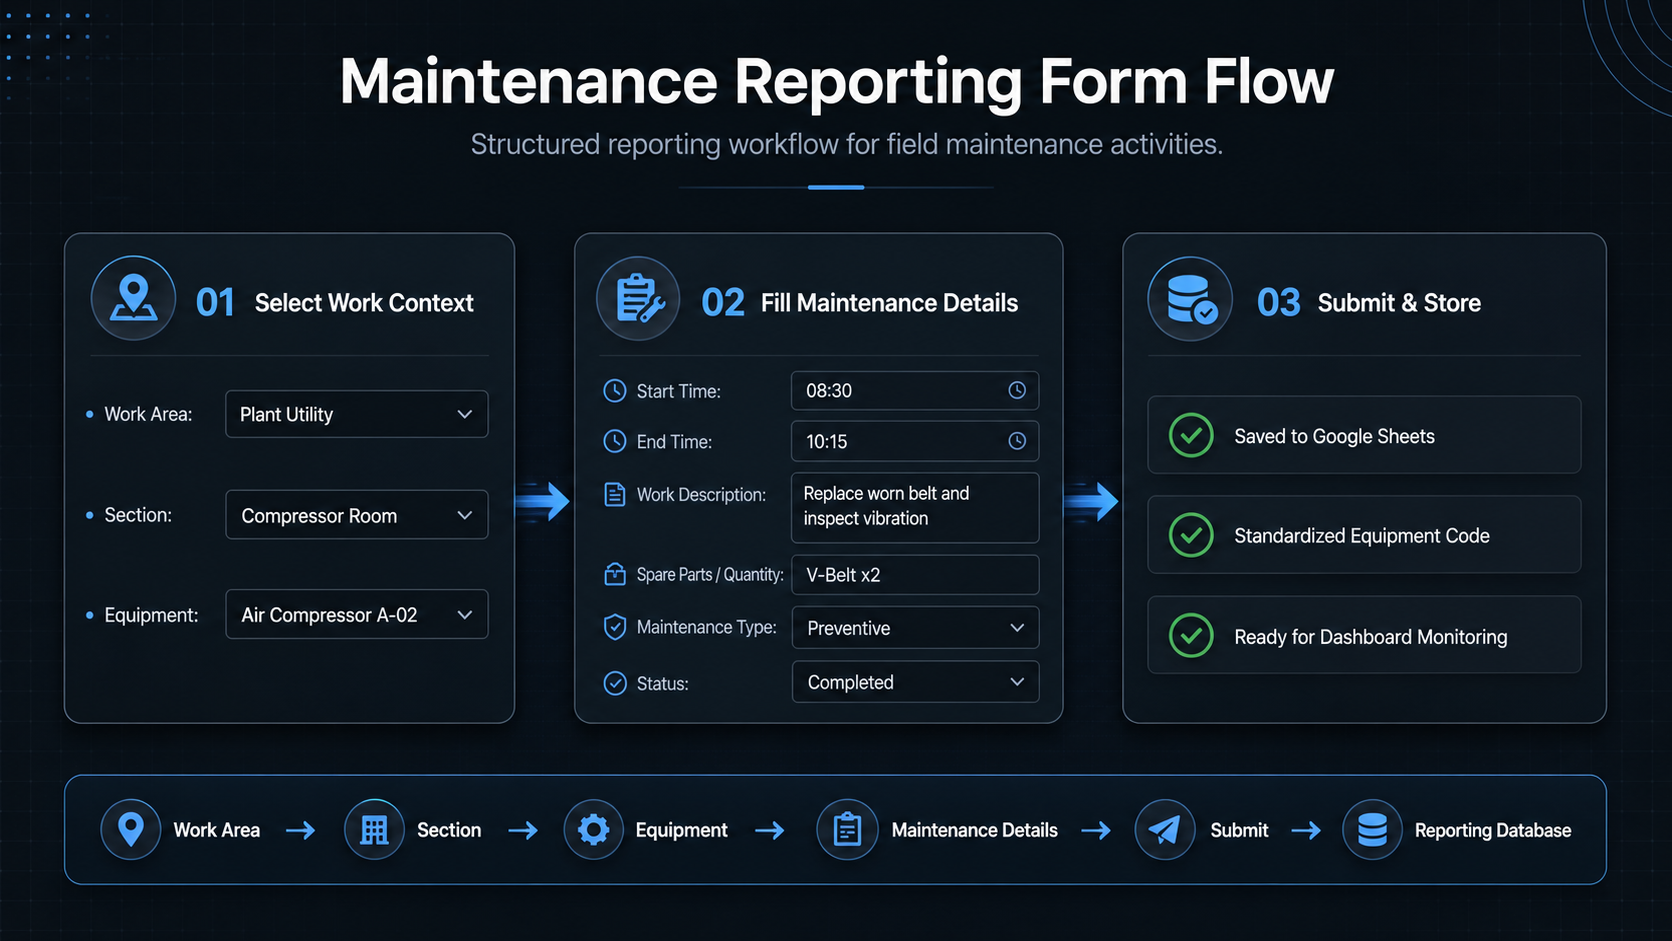
Structured reporting form with area, section, and equipment selection.
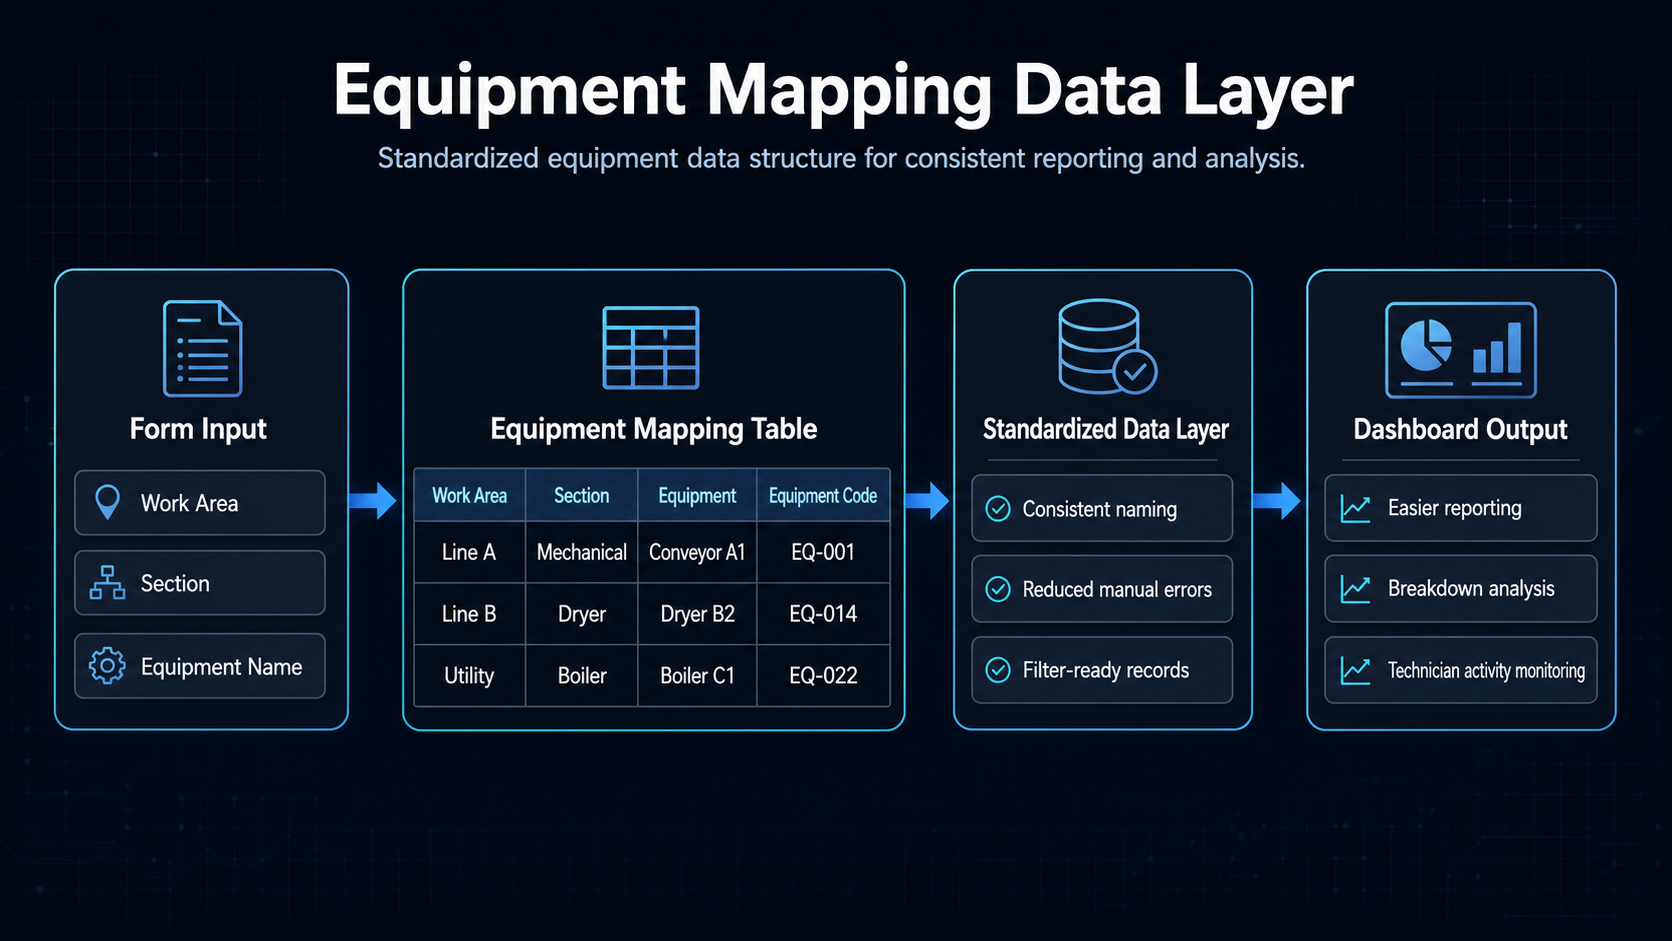
Equipment mapping and standardized data structure for consistent reporting.
Process / Workflow
Mapped the reporting workflow used by field technicians and the Engineering Division. Designed conditional form paths to improve area, section, and equipment selection consistency. Connected form responses into a structured Google Sheets data layer. Built dashboard views for breakdown, downtime, technician activity, and equipment monitoring. All portfolio references are sanitized to avoid exposing company operational data.
Impact or Outcome
Used by 40+ field technicians
Improved reporting consistency
Reduced manual naming errors
Enabled management dashboard monitoring
Helped analyze maintenance activities
What I Learned
Good dashboards depend on consistent input data before visualization begins. Conditional form logic can prevent many reporting errors before they reach the spreadsheet. Operational tools need to match the workflow people already use in the field.
Links
No public repository or live demo is shown for this project because the work is company-related or does not have a public asset yet.